Analysis of Variance (ANOVA) is a statistical test used to assess where differences in means between three or more groups are statistically significantly different. Statistical significance refers to the probability that the relationships observed in our sample, comes from a null distribution. In other words, we are trying to see if the observed differences were likely to have come from a population where there were actually no differences. The steps for this are pretty simple in SPSS, though there are a lot of options that can seem overwhelming at first glance. For now, we are going to skip most of the more advanced options to keep things simple. For an ANOVA test, you need:
- A categorical independent variable (if it has only 2 categories, you would be better off doing a t-test for differences between means instead).
- one or more interval-ratio (or otherwise continuous) dependent variable(s)
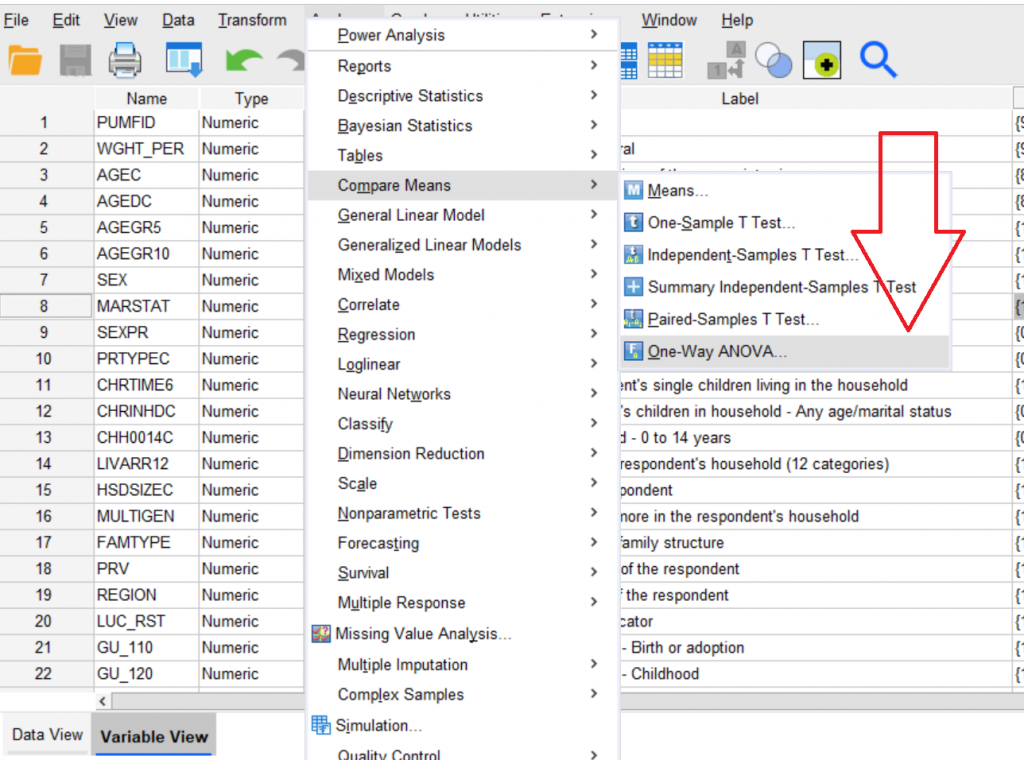
STEP 1: After opening your data in SPSS, click on:
Analyze –> Compare Means –> One-Way ANOVA…
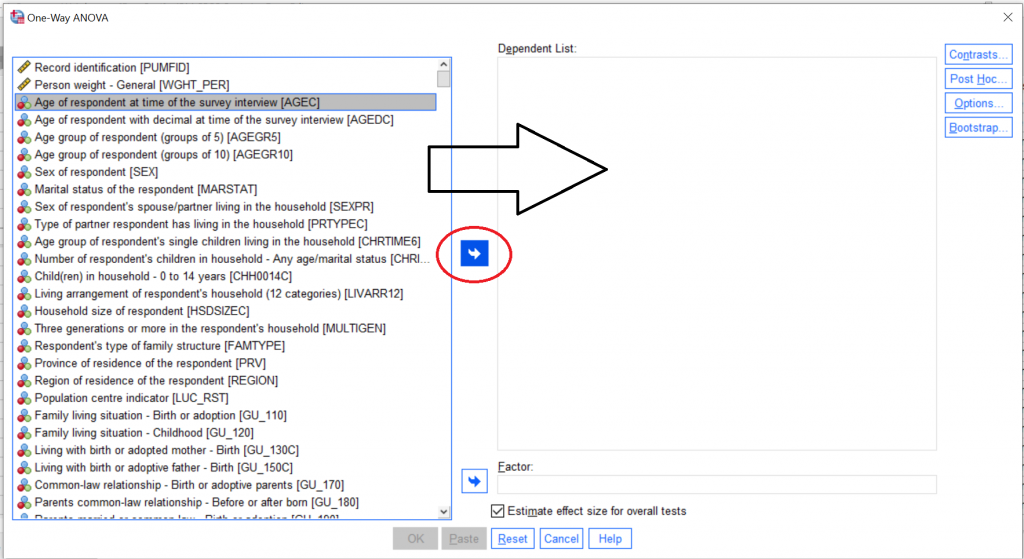
STEP 2. Move the continuous dependent variable(s) you want to analyse from the box on the left to the “Dependent List:” box on the right, using the blue arrow between the boxes.
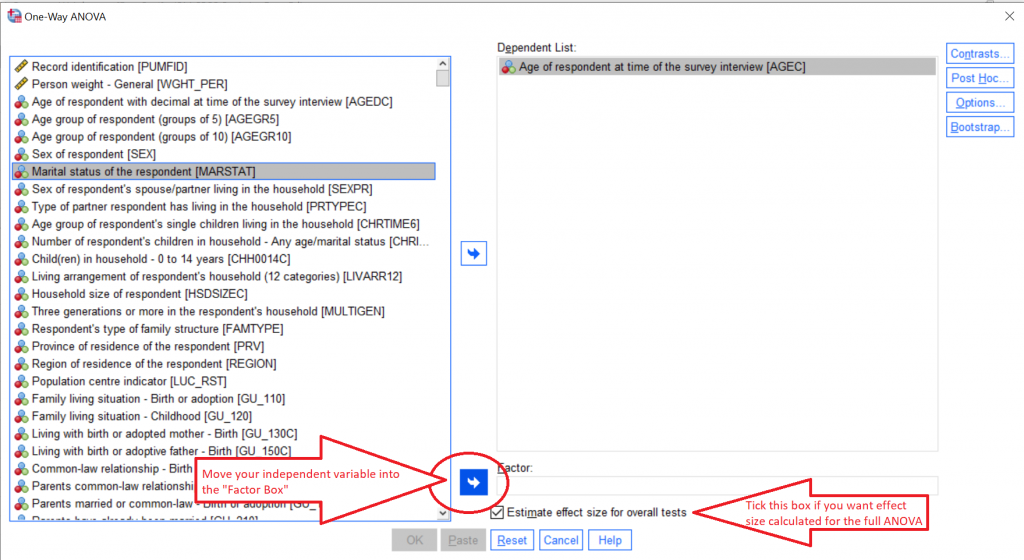
STEP 3. Move your categorical independent variable from the box on the left to the box that says “Factor:” on the right, using the blue arrow circled in the image below. You may also want to tick the box that says “estimate effect size for overall tests if you wish.
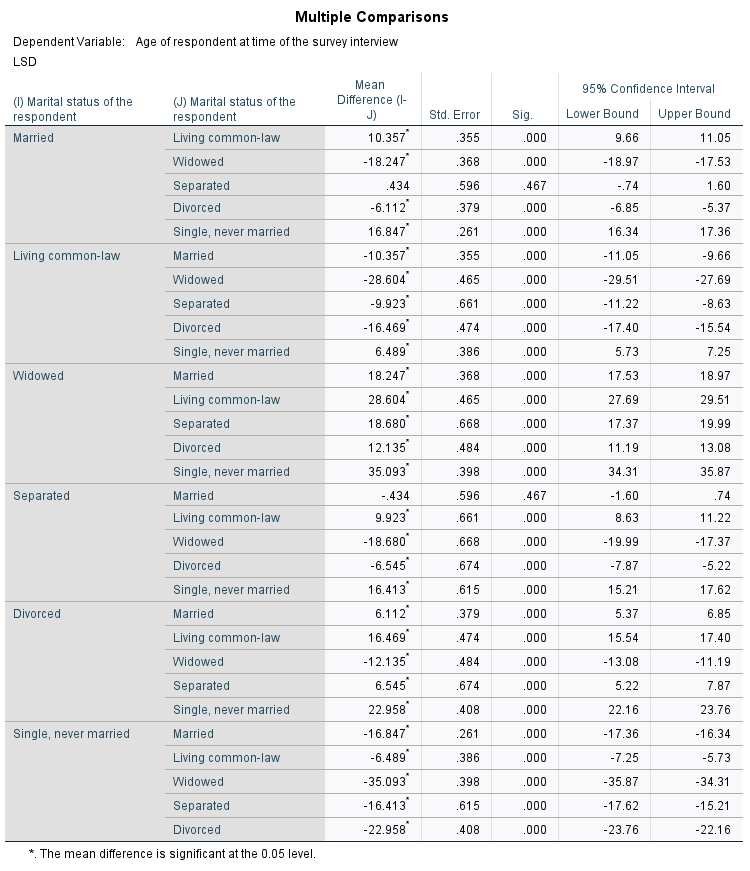
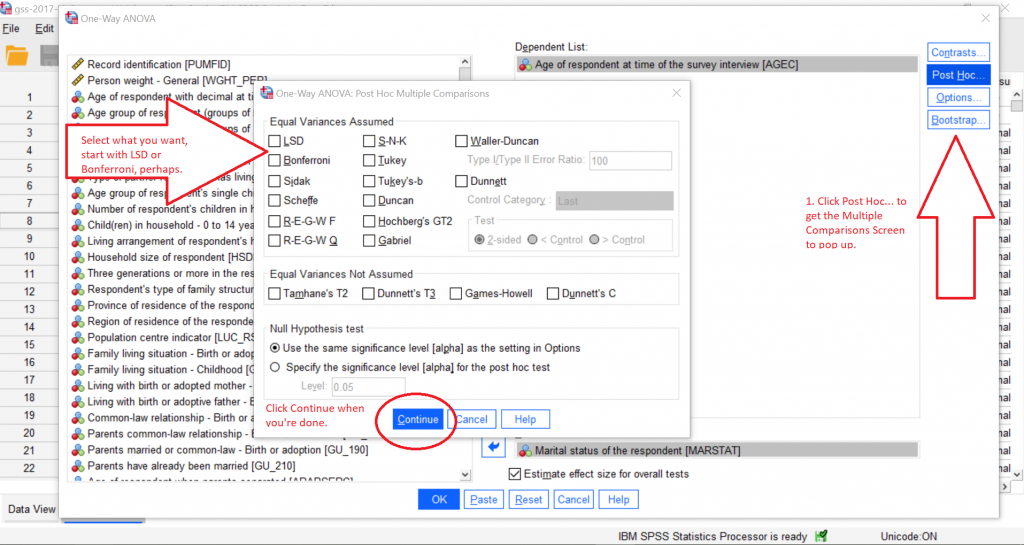
STEP 4. Click the “Post Hoc…” box all the way on the right of the screen, which will open up a new box for Multiple Comparisons between the groups. For example, for our example of marital status and age, the ANOVA test tells us only if there are any significant differences in age between any of the groups in each marital status category. If we are interested in knowing specific differences between groups (e.g. are married people a different age than common-law people), you need a Post-Hoc test. We’re going to tick LSD, (short for Fisher’s Least Significant Difference), which calculates individual t-tests for differences in means between each of the groups in our independent variable.
Select other options as you become familiar with them, then click Continue at the bottom of the menu when you are done.
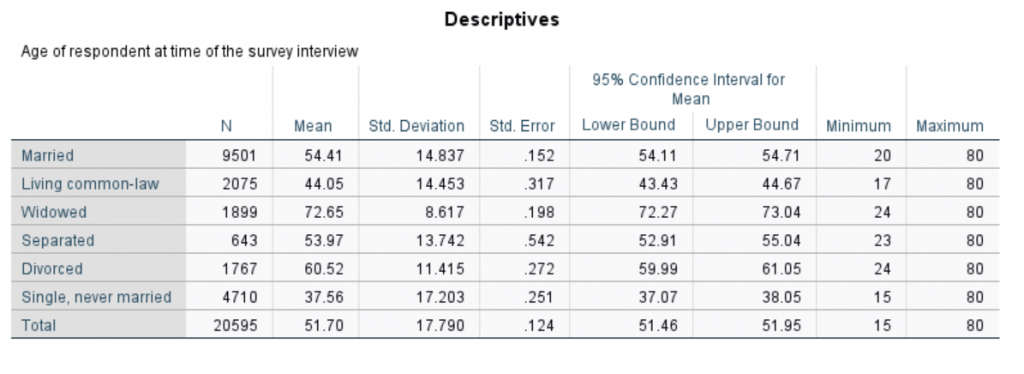
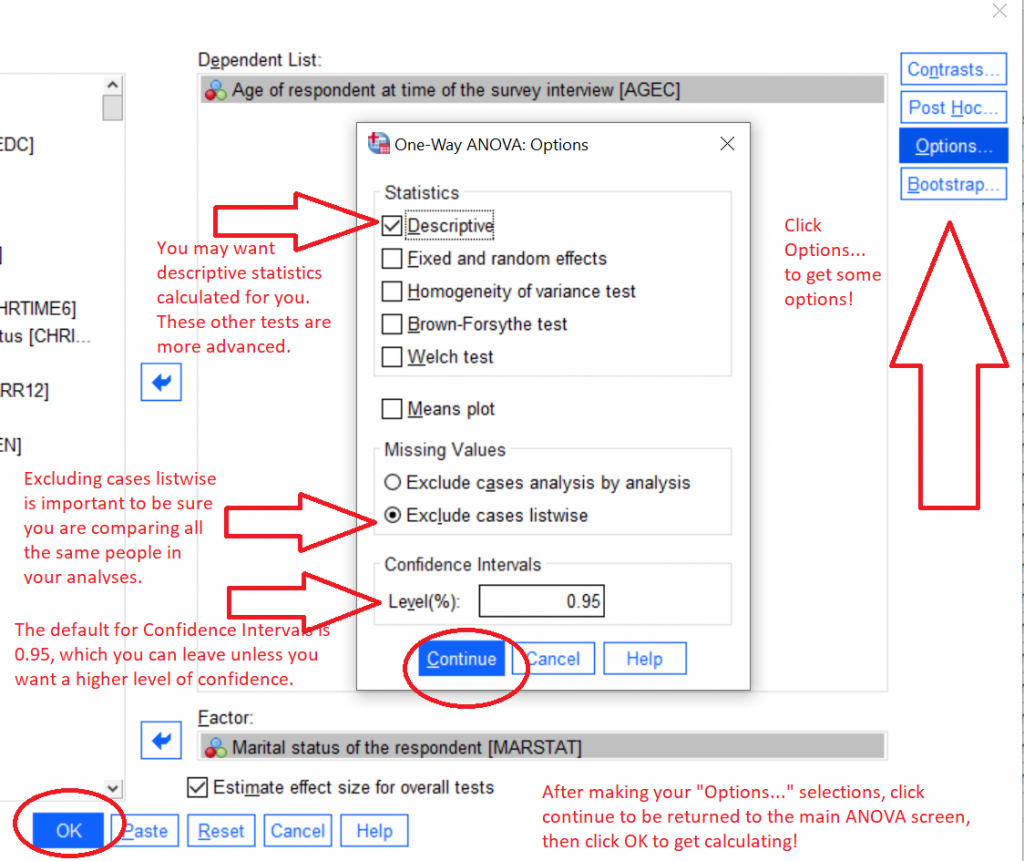
STEP 5. You will be returned to the main ANOVA screen, where you can then click the “Options…” box on the right. This will pop open another menu. For now select “Descriptive” to give you all of the descriptive statistics calculated for each group. Then tick “Exclude cases listwise” to make sure that you are using the same sample of people for every variable you analyse together. The confidence interval confidence level will default to 0.95, which you can leave as is, unless you want a higher level of confidence (normally you would not want a lower level of confidence). Click Continue, to be returned to the main ANOVA page, then click OK to get your results.
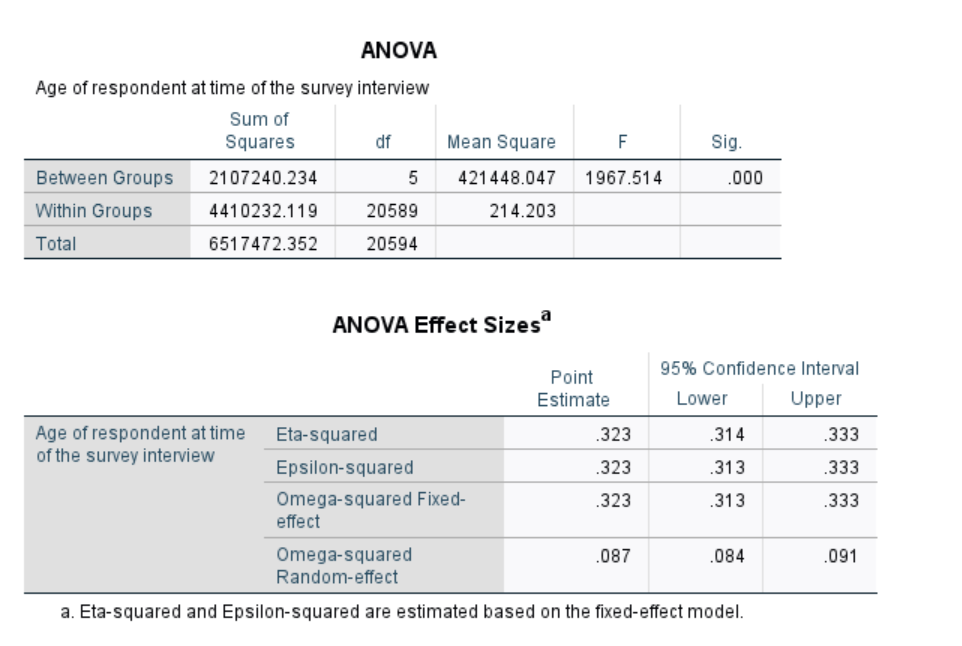
Based on the options we selected, we will get output for the descriptive statistics (note they are separated by category), the ANOVA results, effect sizes for the ANOVA overall, then the LSD results with t-tests calculated for all of the individual differences between each pair of possible groups.