Calculating a t-test in SPSS in order to compare differences between means and/or proportions
What you’ll need variable-wise:
For comparing mean differences between groups: a dichotomous (binary) independent variable and an interval-ratio dependent variable.
For comparing differences in proportions between groups: a dichotomous (binary) independent variable and a dummied dependent variable (i.e. a variable coded 1/0).
The steps in SPSS for calculating a t-test for comparing two independent means or proportions.
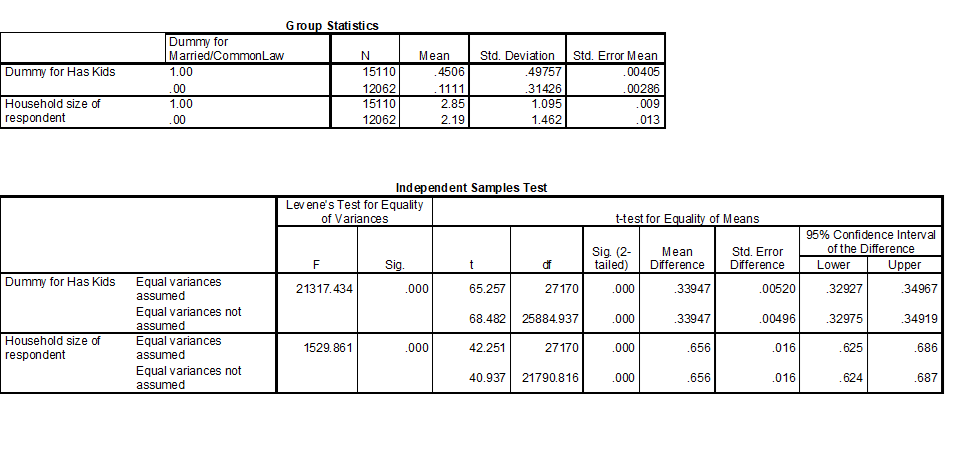
- Analyze –> compare means –> Independent Sample t-tests
- move your dependent variable (the interval variable for testing means or dummy for testing differences in proportions) into the Test Variables box
- move the independent (dichotomous) variable into the grouping variable box à click on define groups –> type in what the categories of the dichotomous variable are (1 & 0 or 1 & 2 or whatever they are)
- Click on options and make sure to tick “exclude cases listwise” (you can also change the confidence level from 95% to something else
- Click OK (or paste if you want to use syntax)
Your Output will look like this:
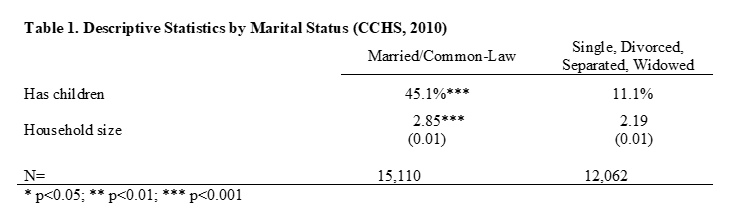
How these data should be presented in a table in a paper:
To do the same thing using syntax:
*check your work with a crosstab*.
crosstabs marstat by dummarcom.
****************************
* Recoding your variables *
****************************
*create a binary independent variable*.
RECODE MARSTAT (1=1) (2=1) (SYSMIS=SYSMIS) (3 thru 6=0) (ELSE=SYSMIS) INTO DumMarCom.
VARIABLE LABELS DumMarCom ‘Dummy for Married/CommonLaw’.
recode CHINHSDC (1 thru 3=1) (0=0) (else=sysmis) (sysmis=sysmis) into dumHasKidsHousehold.
variable labels dumHasKidsHousehold ‘Dummy for Has Kids’.
*check your work with a crosstab*.
crosstabs CHINHSDC by dumHasKidsHousehold .
*explore the interval-ratio variable with a frequency table or descriptive statistics to make sure that missing data is not included in the analyses*.
freq hsdsizec.
********************
* Running t-Tests *
********************
T-TEST GROUPS=DumMarCom(1 0)/MISSING=LISTWISE/VARIABLES=dumHasKidsHousehold HSDSIZEC /CRITERIA=CI(.95).