Measures of central tendency–such as the mean, median, and mode–tell us about the general trend of the cases in our sample. Do the responses fall closer to one end of the distribution or another? Are people generally high or low; young or old; or whatever might be our variable. To get these statistics using the pull-down menus in SPSS, follow the following steps.
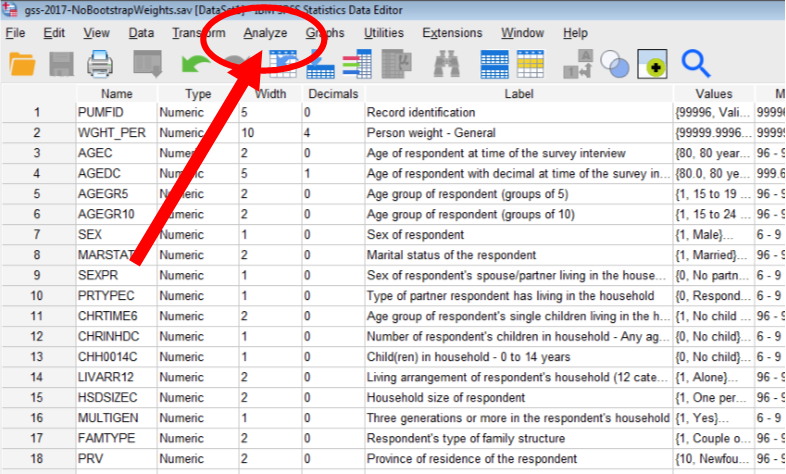
- Click on Analyze on the top navigation bar
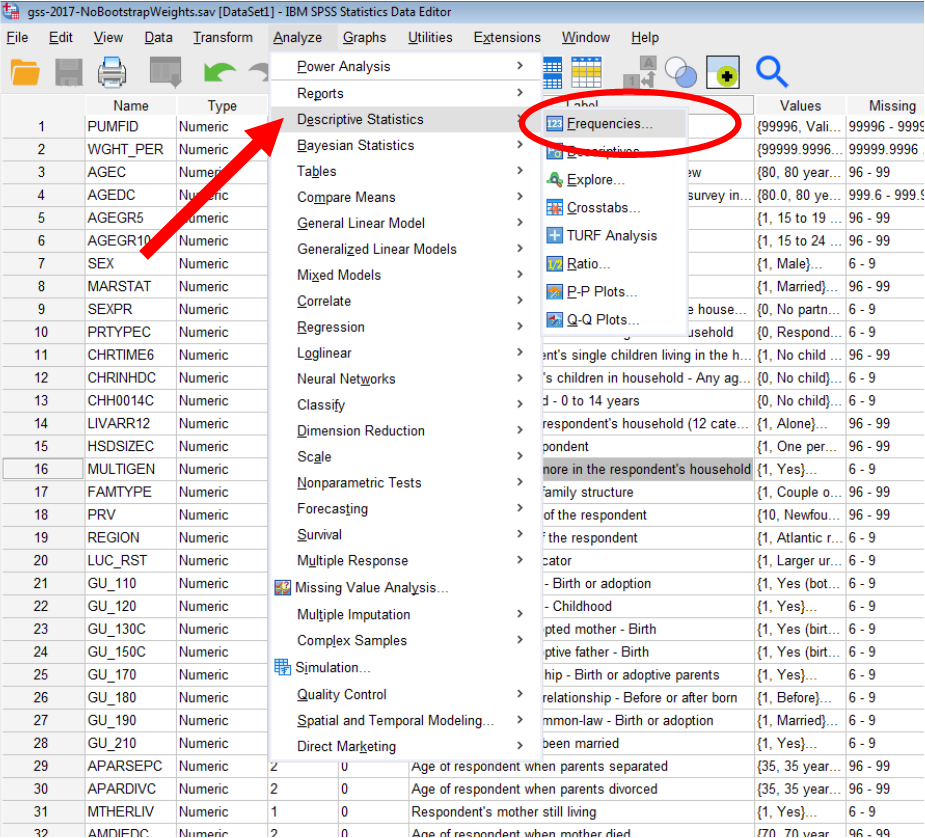
2. Click on descriptive statistics, then frequencies:
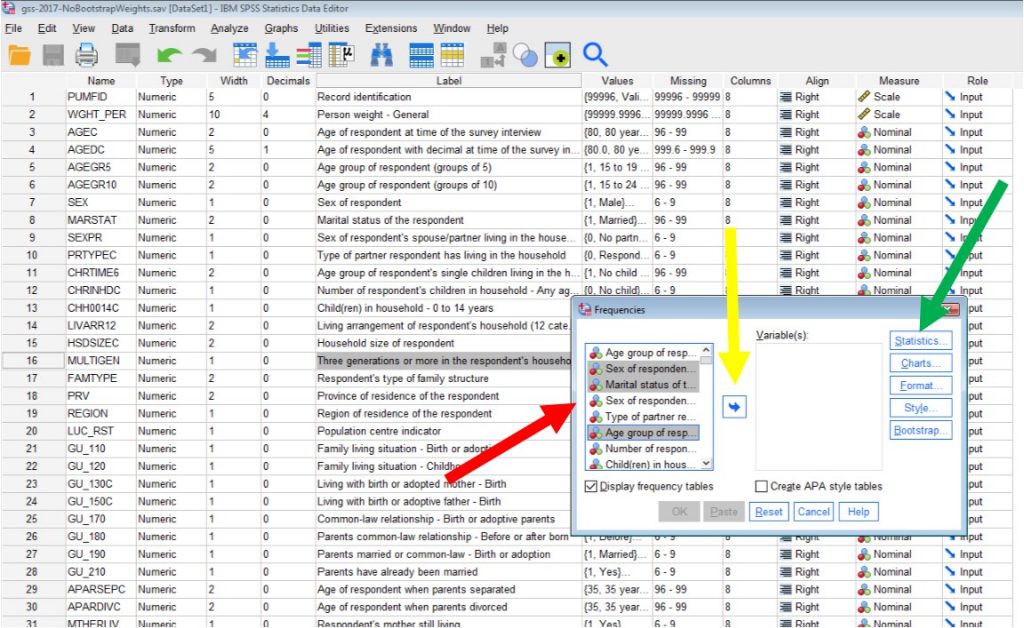
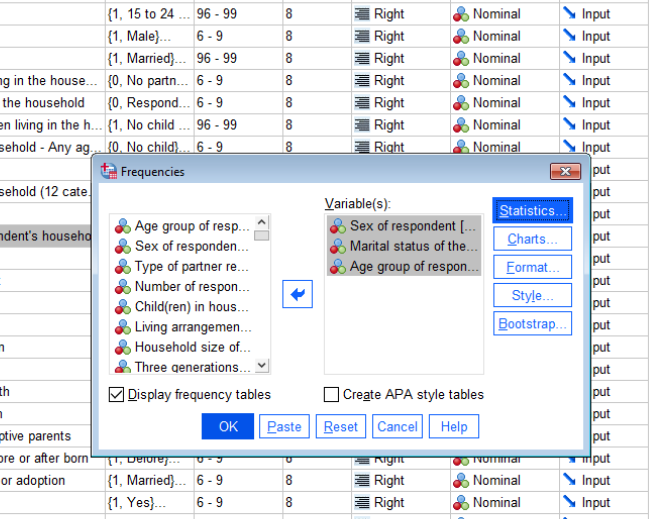
3. A box will pop up with a list of all the variables in your data on the left and an empty box on the right. Highlight the variables you want on the left (red arrow), then click on the arrow to move them to the box on the right (where the yellow arrow is pointing). Then click the box that says statistics (where the green arrow is pointing).
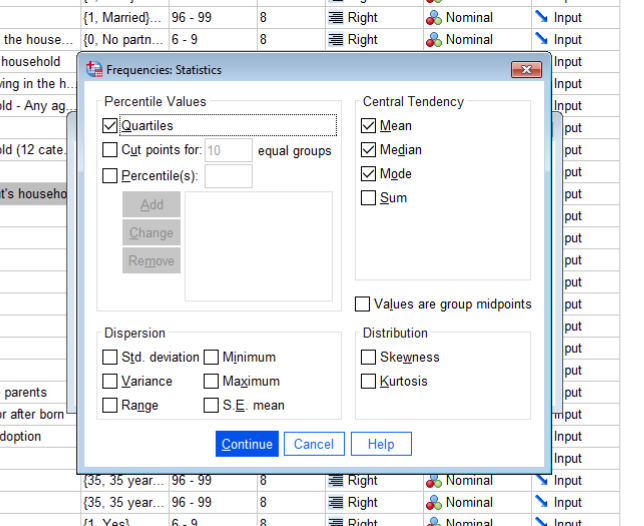
4. A box will pop up in the middle of your screen where you can tick off any measures of central tendency, percentages, skewness, and variation, you are interested in. Click continue after you pick the stats you want calculated.
5. You will be returned to the main frequencies box. If you do not want frequency tables produced with your descriptive statistics, you can unclick “display frequency tables.” If you want them, just leave that box ticked. Click “OK” to get your results.
6. Your output should show up in a separate screen and file (called an .spv file). The output should look something like this, where you’ll find the measures of central tendency first, followed by frequency tables (if selected above).
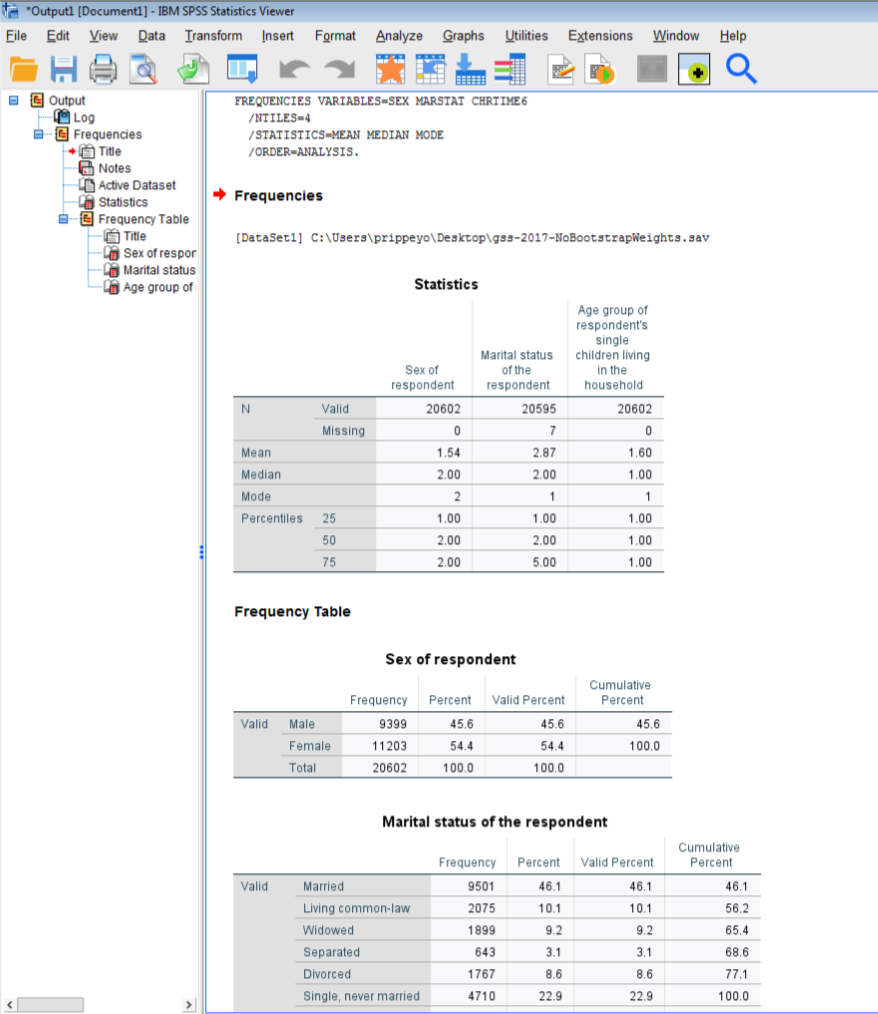
Always remember when interpreting your statistics to use your mind and not rely on what SPSS does for you. In this example, SPSS calculated a mean for sex of respondent, marital status, and age group, but none of these values should be interpreted given that none of these variables are measured at the Interval-Ratio level.