- Always save a clean version of your data that you do not touch (especially if accessing your data is difficult) / Never save over your only data file with recoded variables
- Always use syntax, so you have a record of what you are doing
- Keep your syntax nicely organized
- Use notes liberally in your syntax, in SPSS and STATA this means starting a line with *
- Organize syntax into sections, e.g.
Category: Statistics
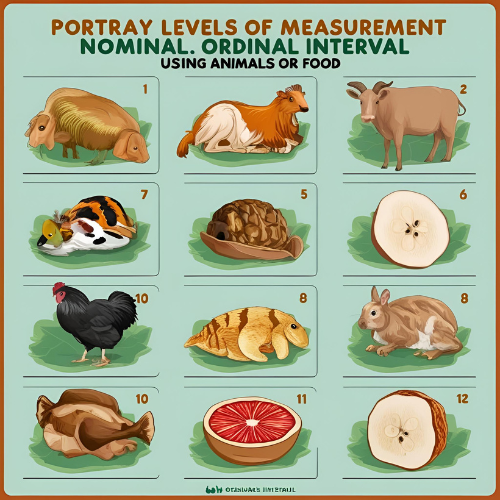
Levels of Measurement
Any statistics you calculate requires knowing what the level of measurement is, which means that you gotta know this to get very far with statistics. So what it is? I might say that level of measurement refers to the degree of quantification of a variable.… Read More “Levels of Measurement”
Read More
Frequency Tables
FREQUENCY TABLES
Frequency tables are kind of what they sound like: tables that show the frequency (or how many times) a particular response is given. These are particularly useful for summarizing your data when you have a lot of cases. It’s hard to see what’s going on when all you have are the individual responses each person gives, so frequency tables help us to organize those responses into some kind of meaningful order.… Read More “Frequency Tables”
Calculating a mean or standard deviation from a frequency table
Calculating a mean or a standard deviation is not something done all that often, given that you can only calculate such statistics with interval or ratio level variables and most such variables have too many values to put into a frequency table that will be informative beyond what raw data would look like.… Read More “Calculating a mean or standard deviation from a frequency table”
Read More
Samples vs. Populations
When doing social research, what we care about most are populations, but what we have access to are samples. Samples are subsets of a population that we use to make estimates about populations. For example, if I wanted to know about American attitudes about the president, I couldn’t just pick up the phone and call the 327+ million American people and say “hey, gurrrl, what do you think about the prez?”… Read More “Samples vs. Populations”
Read MoreBeware of online consumer surveys
Funny story… so, a “friend” of mine may have a bit of an obsession with a particular app that allows a person to decorate rooms. It’s silly and leads this friend to zone out more than she probably should, but it’s one of her guilty pleasures.… Read More “Beware of online consumer surveys”
Read More