Carrying out statistical analyses by hand can only take you so far. Usually, we need computers to help us manage large amounts of data. One software program that is used by a lot of people is SPSS. There are many other programs you could use to manage data, such as STATA, R, SAS, or even Excel.… Read More “Pros & Cons of SPSS”
Read MoreCategory: Software
Opening Data in SPSS
Step 1. Open SPSS on your computer
The first screen that’ll pop up asks what data you want to open. I usually just ‘x’ out of this screen or hit cancel.
Step 2. You’ll end up on a blank spreadsheet. To open the data:
1) click “file” in the top left hand corner, then
2) Open, then
3) Data
Note: Other types of files you are likely to need are “syntax” where you can type in code and “output” where you will be getting your results.… Read More “Opening Data in SPSS”
Exploring Data in SPSS
Before setting out to analyse or recode any variables, one needs to know what’s going on with the variables of interest. A few ways to do this that I’m going to show you a few ways to do this by calculating/creating:
- Frequency Tables
- Descriptive Statistics
- Graphs
Before doing any of these steps, make sure you have your data open first.… Read More “Exploring Data in SPSS”
Read MoreRecoding Variables in SPSS
After you’ve opened your data in SPSS and explored your data, you will likely want to recode some or all of your variables. Perhaps you want to change marital status so that married people and those in common-law relationships are counted as the same.… Read More “Recoding Variables in SPSS”
Read MoreSplitting Data by a Variable
If you want to calculate any statistics split into the different categories of a variable, you can do this easily in SPSS. All you need to do is the following:
- Click on “Data” from the pull-down menus
- Click on “split file” found almost all the way at the bottom of the list of commands
- Toggle the circle at the top that says “Compare groups”
- You will now be allowed to move the variable you want to split your data by, from the box on the left into the “Groups Based on:” box on the right .
Calculating Measures of Central Tendency in SPSS
Measures of central tendency–such as the mean, median, and mode–tell us about the general trend of the cases in our sample. Do the responses fall closer to one end of the distribution or another? Are people generally high or low; young or old; or whatever might be our variable.… Read More “Calculating Measures of Central Tendency in SPSS”
Read MoreCalculating Confidence Intervals in SPSS
Statistical estimation is the technique of making inferences (or estimates) about a population based on sample data. Because we cannot know precisely what is happening with a population, we can only make our best informed assessments from what we know of our random sample.… Read More “Calculating Confidence Intervals in SPSS”
Read MoreCalculating a t-test in SPSS
Calculating a t-test in SPSS in order to compare differences between means and/or proportions
What you’ll need variable-wise:
For comparing mean differences between groups: a dichotomous (binary) independent variable and an interval-ratio dependent variable.
For comparing differences in proportions between groups: a dichotomous (binary) independent variable and a dummied dependent variable (i.e.… Read More “Calculating a t-test in SPSS”
Read MoreANOVA in SPSS
Analysis of Variance (ANOVA) is a statistical test used to assess where differences in means between three or more groups are statistically significantly different. Statistical significance refers to the probability that the relationships observed in our sample, comes from a null distribution.… Read More “ANOVA in SPSS”
Read MoreChi-Square in SPSS
Chi-Square in SPSS
Calculating a chi-square statistic in SPSS is quite simple, as long as you have two categorical variables. The much harder part is in the interpretation (which we’ll get to way down below). In the example here, we are using 2016 Census (Canada) data with the following variables:
- School Attendance, asked in the survey as “At any time since September 2015, has this person attended a school, college, CEGEP, or university?”
The Basics of STATA
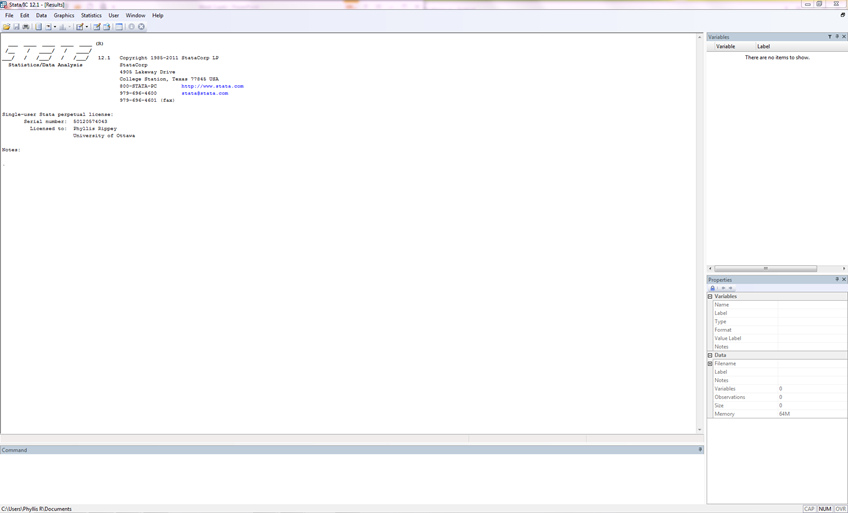
There are three main types of files used in Stata:
Data File: Filename.dta
Syntax File: Filename.do
Output file: Filename.log
The data file is where all the data live. The syntax is where you tell STATA what to do with your data.… Read More “The Basics of STATA”